Prime Central London Investment: Part 1
In previous years, Prime Central London (PCL) has enjoyed consistent annual price growth with limited downside. It has made the area one of the world’s leading real estate markets for investment. However, as the coronavirus pandemic swept across the globe, some distinct changes to the industry have come with it. International travel bans have meant that overseas investors have not had the same opportunities and multiple national lockdowns have restricted domestic buyers.
With all this in mind, Ludgrove Property has undertaken research to look at how this property recession is faring in comparison to some of the biggest recessions the country has seen.
Ludgrove has found that since the PCL market peaked in 2014, values have fallen considerably whilst at the same time quantitative easing (QE) and near-zero interest rates have inflated assets. What is remarkable, is how rarely PCL values are compared within this context. Here, Ludgrove Property uses unique research to show just how far prices have fallen.
Prices are at a 13 year low
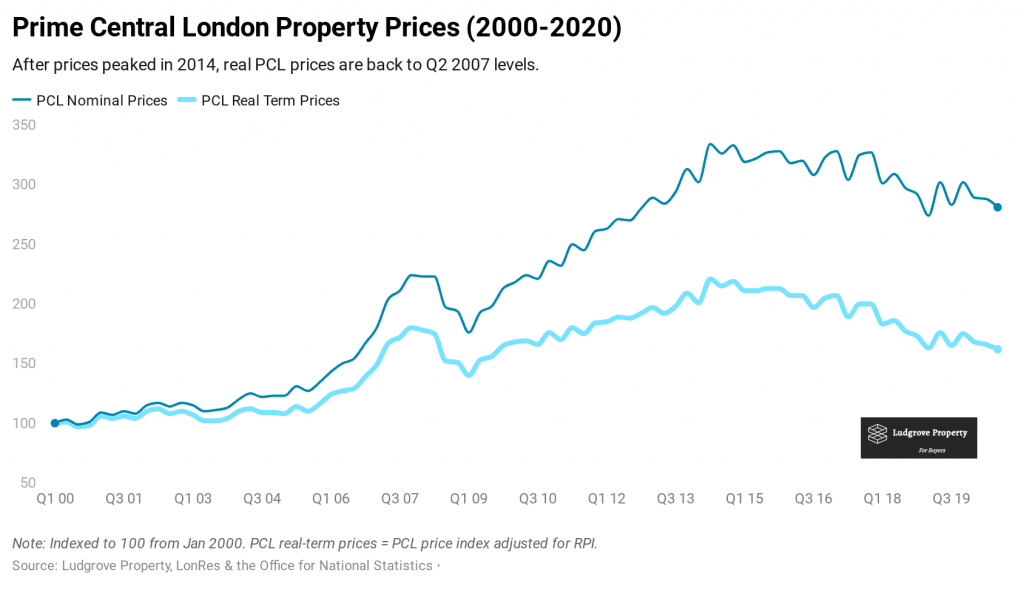
The consensus view is that prices peaked in 2014 and have fallen around 16-20% (depending on the source). However, over the long term, it is important to assess property prices in real (i.e. inflation-adjusted) terms to modify for changes in purchasing power.
Since the market peaked in mid-2014, prices have fallen 30% in real terms and have now returned to mid-2007 levels. Effectively then, there has been zero growth in PCL values in the last 13 years.
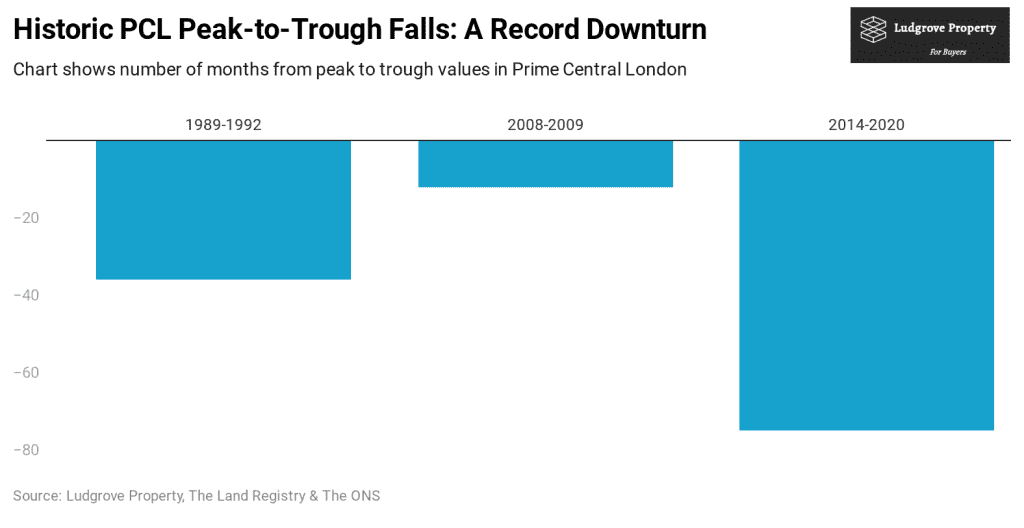
The decline is the longest on record
Prior to this recession, the average PCL downturn lasted 24 months. However, the current PCL real estate recession has run for 75 months and counting – far outstripping the 1989-92 and 2008-2009 downturns. Clearly, recovery from these levels is long overdue.
And prices are at a level where they have historically recovered
Whilst the -30% real-term decline in this cycle has not been quite as severe as the 1989-92 recession (-34%), prices are broadly at the level where the market has historically troughed and then recovered.
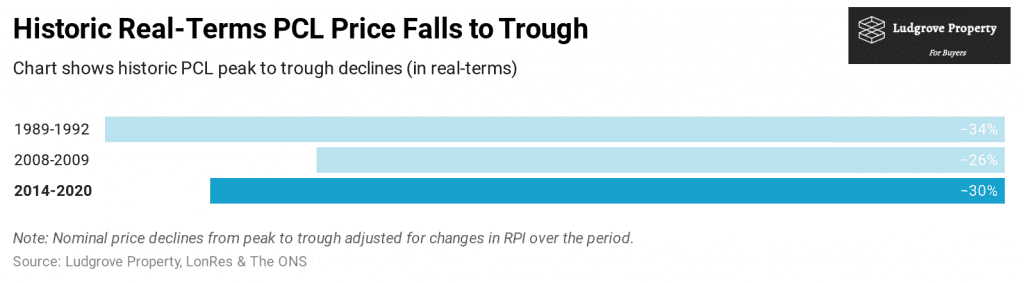
Separately, it is notable that the average 5 year forward capital growth of PCL coming out of recession is 75% (or 12% p/a over a 5-year period).
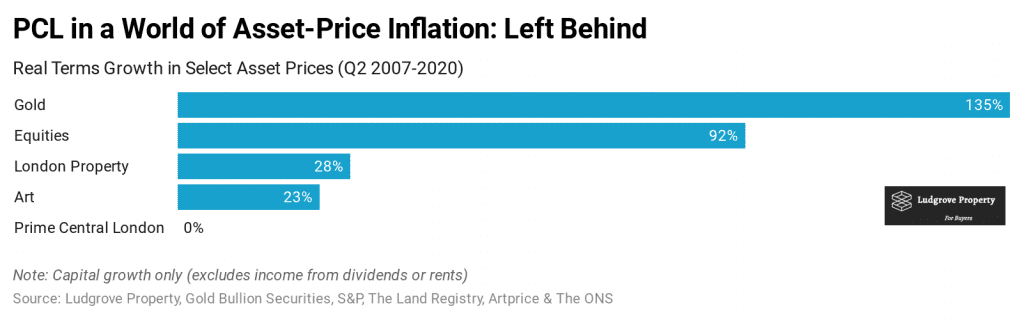
Whilst quantitative easing has inflated other assets
It is also important to look at PCL property values within the context of QE and the effect this has had on inflating assets more broadly. Taking Q2 2007 as our starting point, it is extraordinary that PCL has returned 0% in real terms whilst other asset classes have powered ahead.
As you can see, prices in real terms are the lowest in 13 years and the decline from the 2014 peak is the longest and one of the deepest on record. The PCL recession looks anomalous in terms of its length and in the context of vast amounts of QE. We will expand on this in our next article.
Stay tuned for the next part in this series in partnership with Ludgrove Property. Ludgrove is a research-driven Prime London property buying agency, sourcing properties for homeowners, investors, family offices and developers. Sign up for our newsletter at the bottom of our website to get alerts directly to your inbox.